Initially the debugger shows disassembled Z80 code at the current PC address. This is known as the Disassembly View.
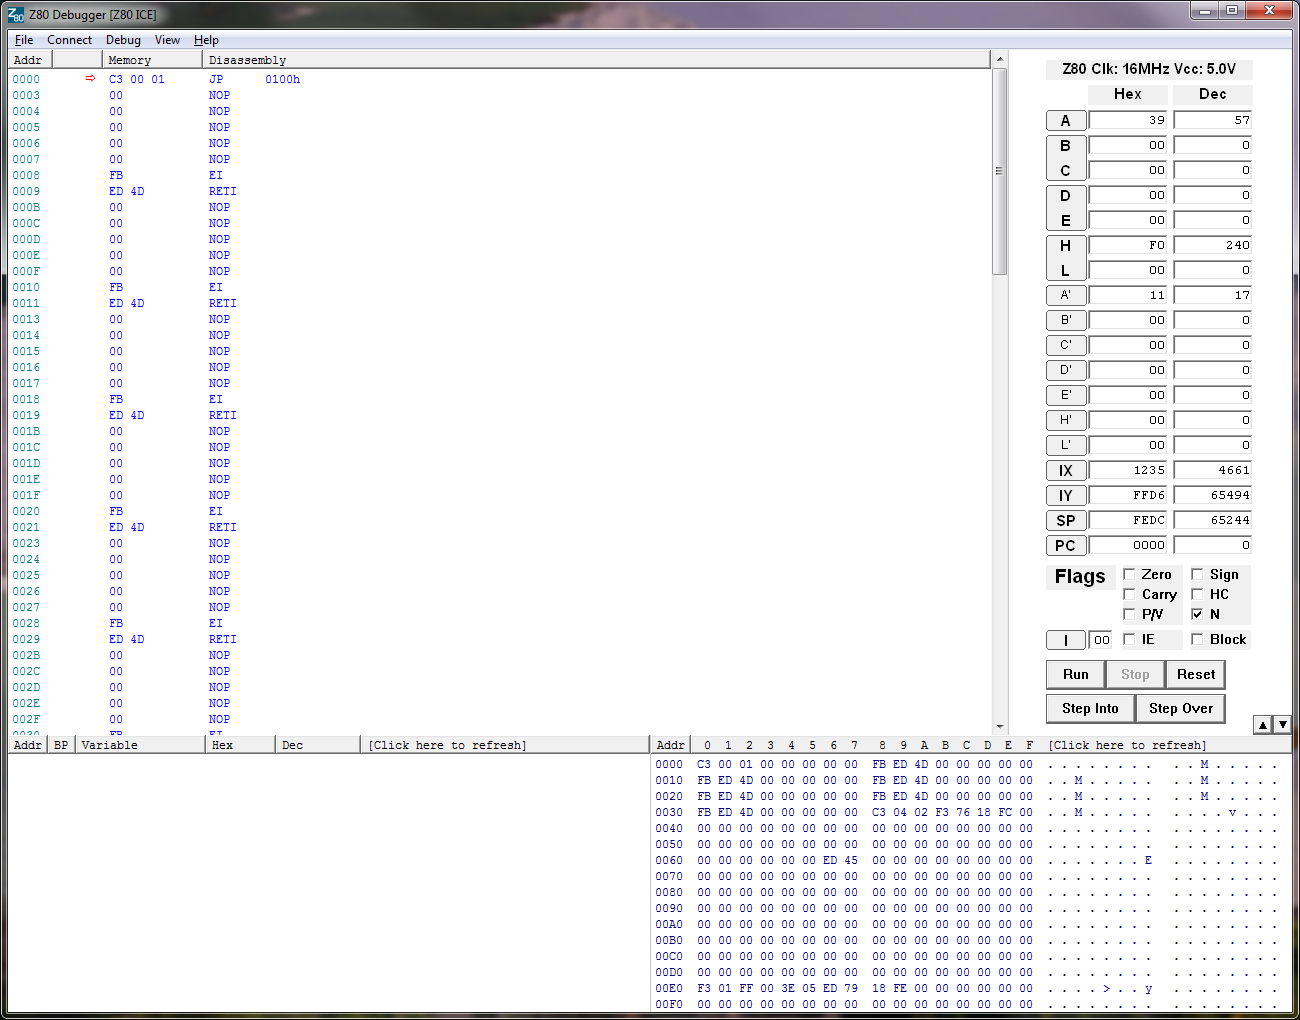
If you are debugging ROM on a hardware target, you are stuck with this view but most development is done by loading a program into target RAM.
If you have loaded source code, your code will be visible. This is known as the Code View. The F12 key switches between the Code View and Disassembly View. If you have loaded binary, only the Disassembly View is available. The Disassembly View reads the memory and shows the opcodes and decoded mnemonics, whereas the Code View shows the file contents which may or may not be the same as the current memory contents (could be ROM, could have been remapped, could have been overwritten etc).
The following images show the same code in Code and Disassembly views...
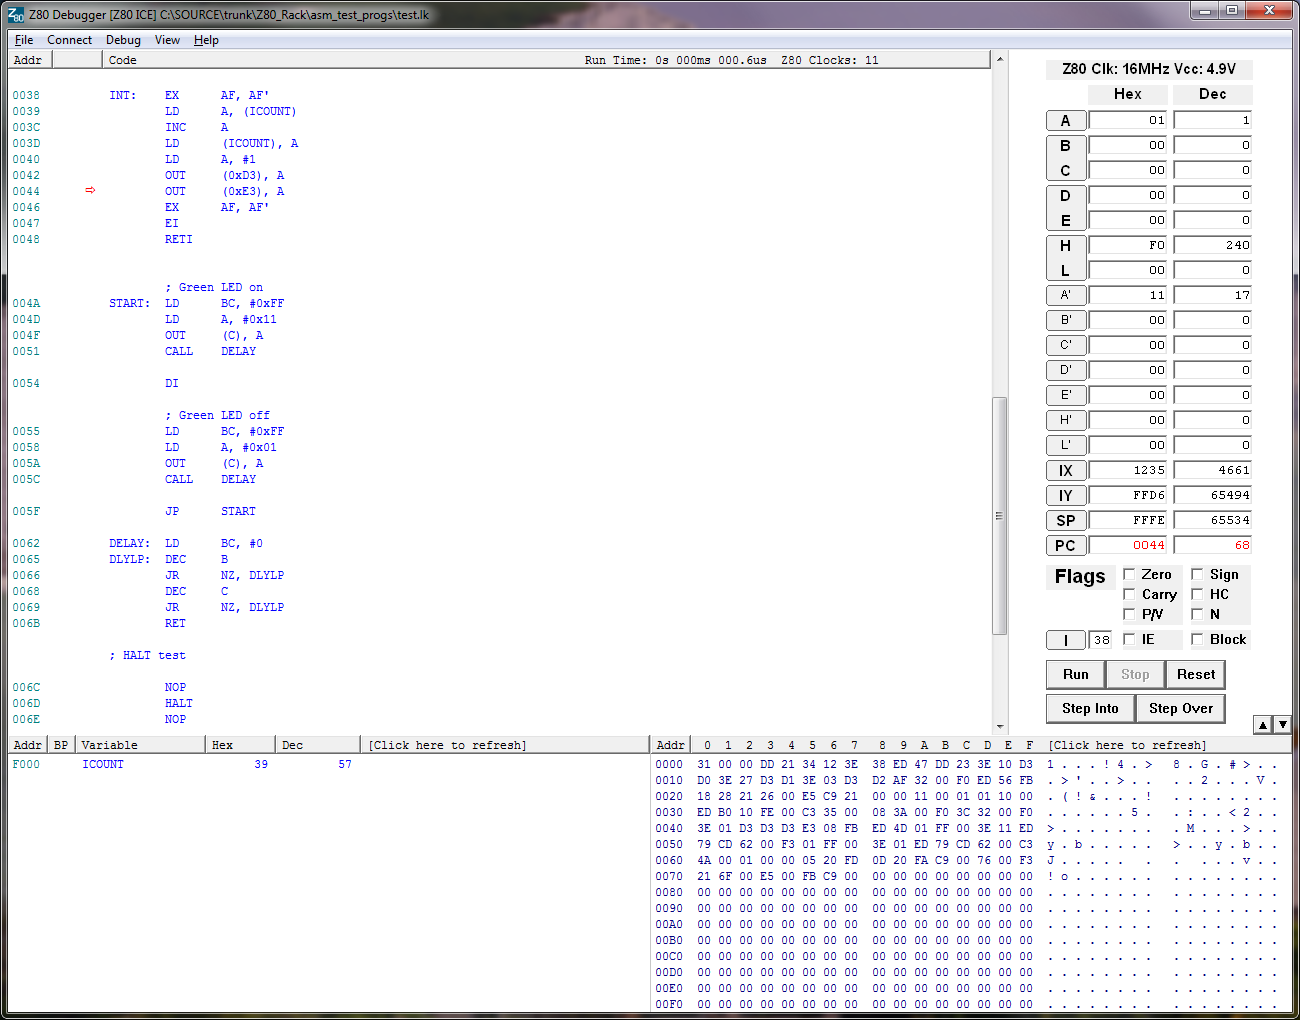
In the Code View view above, the user labels and comments are visible and the ICOUNT variable appears in the Variables View with its memory address and value. For example at address 001A the variable ICOUNT is written and at address 0020 is a jump to the START label.
At the top of the source file is a comment block containing the file name. This is not part of the user's source code. It is inserted by the debugger when it stitches together all the source files so the user can see which file the code came from originally.
The view can be moved using the scroll bars, page keys, cursor keys and the mouse scroll wheel. The whole view can be scrolled and includes all the source files stitched together in address order (if a file contains multiple address regions the file won't be split up, so it may not always be possible to achieve strict address order).
The PC address is shown with a red arrow. If you change the PC in the register box on the right, the arrow will move and the view will be re-drawn.
Ctrl-F and the F3 key work in the normal way to find text in the Code View so you can search for a function or label and put a breakpoint on it for example.
Ctrl-G allows you to jump to a specific address.
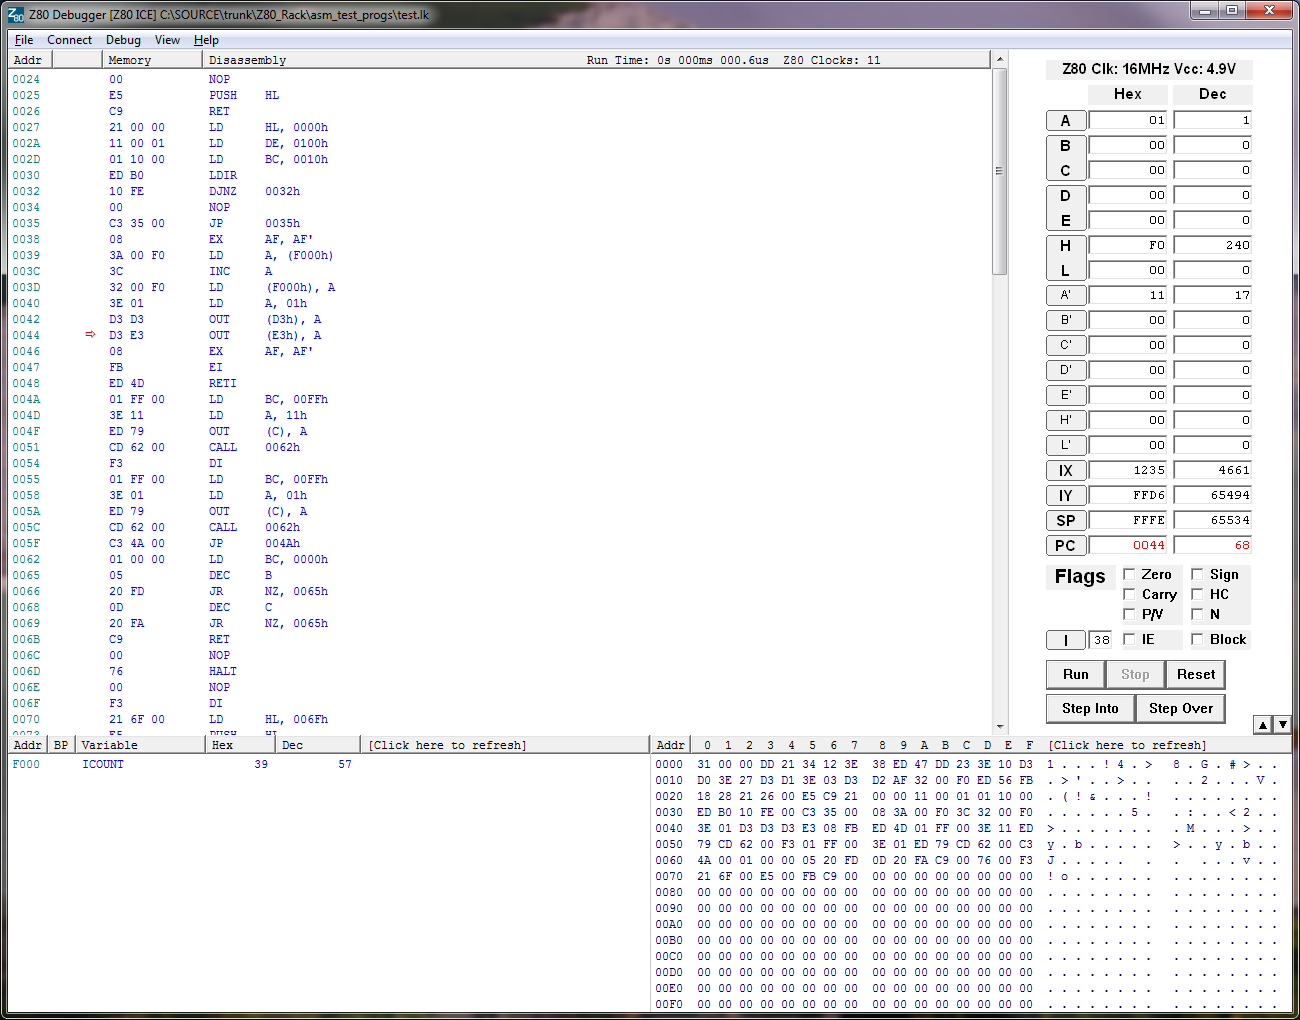
In the Disassembly View above, jump addresses are shown instead of labels and the variable is not visible. Looking at address 0020, we can see that the jump to START is to address 004A. However, unlike in the Code View, the opcodes are shown which can be useful.
The view can be moved the same way as the source code but only a small amount of memory is disassembled due to the time it takes to read target memory, so the listing runs out when scrolling. To view code that is outside the disassembled portion, you have to set the PC to that address. When stepping, the debugger re-reads the target memory on every step and re-builds the view as required. If the new PC address is on the same page and the code in memory hasn't changed, it uses the same view as before the step (just moves the execution point). If you execute a jump for example, then it re-builds the view.
Ctrl-F doesn't work in the Disassembly View but Ctrl-G does.
When stepping through source code, if the debugger can't find a line at the address in any source file, it will automatically switch to the Disassembly View. This happens when stepping C code through a library. For example you may have a line that calls a math function such as division which is implemented by a compiler library function (the Z80 doesn't have multiply or divide instructions). Since the compiler library source is not available to the debugger, it switches to Disassembly View as you step into the divide function and switches back to the Code View when you return from the divide function.