There are three types of breakpoints you can set, described below.
With an emulation target, there is no limit to the number or types of breakpoints. See Hardware Limitations for limits with a hardware ICE.
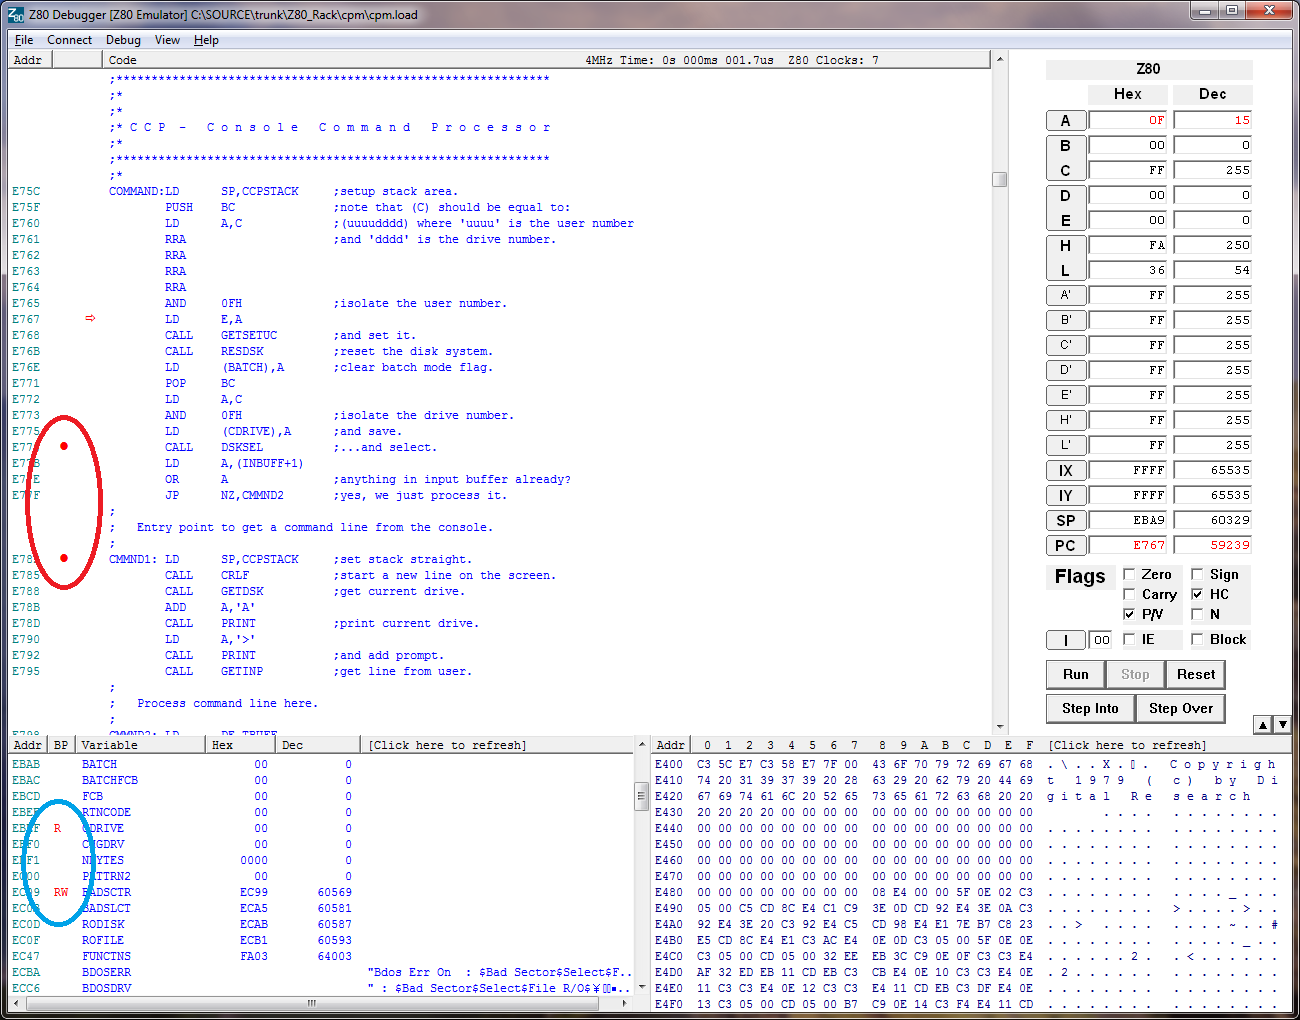
Program breakpoints shown in the red circle.
A program breakpoint will cause the Z80 to stop before it executes the line with the breakpoint. To set or remove a program breakpoint, double click on the required line in the code view or disassembly view. A red dot indicates a line with a breakpoint set.
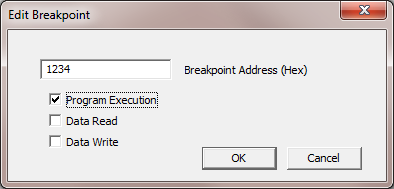
Program breakpoints can also be set with Edit Breakpoint... on the Debug menu (see image below). This allows a breakpoint to be set on code that isn't loaded or is written by the Z80 e.g. code that is downloaded into RAM. Normally you would only set a single byte breakpoint on the instruction address but it is possible to set multiple program breakpoints in a block using the Number of Bytes box but be aware that setting a breakpoint that isn't on the first byte of an instruction will result in undefined behaviour on hardware.
Data read breakpoints shown in the blue circle.
A red 'R' in the BP column indicates an address with a data read breakpoint set. A data read breakpoint will stop the Z80 on the instruction after the memory is read. If the breakpoint was on the stack and a RET caused the read, the PC will likely be on an instruction following a CALL in a completely different part of code.
There are additional restrictions for read breakpoints on hardware, see Hardware Limitations.
Data write breakpoints shown in the blue circle.
A red 'W' in the BP column indicates an address with a data write breakpoint set. A data write breakpoint will stop the Z80 on the instruction after the memory is written which means the variable value will have changed. If the breakpoint was on the stack and a CALL caused the write, the PC will be at the called address.
Repeating instructions such as LDIR are a special case. If a data breakpoint is triggered by a read or write during a block transfer, the PC will be on the LDIR instruction unless it was the last transfer (BC=0) but the dialog box will describe the normal case (PC being on the instruction after the memory access). This is because of the way the Z80 repeating instructions work where they can be resumed after an interrupt, or in this case, after a breakpoint. Each byte copy causes the registers to be adjusted so that the instruction can be re-run to continue the transfer and the PC is set to the LDIR until the transfer is complete. The debugger cannot tell if the data breakpoint was triggered by the LDIR or by another instruction which took the PC to the LDIR such as a RET reading the stack to trigger a breakpoint. Fortunately it is usually fairly obvious what caused the breakpoint to be triggered.
To set data breakpoints, double-click on the required variable. This opens a dialog box where the breakpoints can be set.
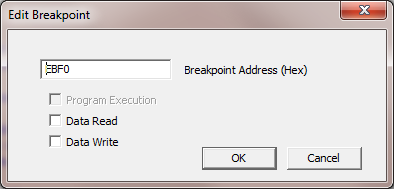
The same dialog box can be opened with Edit Breakpoint... on the Debug menu. The double-click method fills in the variable address and size and disables the program breakpoint checkbox. Using the menu, any combination of breakpoints can be set on any address. This allows you to put a breakpoint on an unlisted variable. If you are debugging problems such as variable corruption, it may be necessary to put data breakpoints on all the bytes in an area of memory for example.
If you want to trap NULL pointer accesses, put a data breakpoint on address zero or a range of addresses near zero to catch NULL struct element accesses. It is not recommended to set data read breakpoints if you also have code in the same area as the code won't run on hardware, only use data write breakpoints.
With a hardware ICE there is no limit to the number of program breakpoints but the entry level ICE doesn't support data breakpoints. On this model, the data breakpoint checkboxes are disabled and double-clicking variables does nothing.
IMPORTANT: The Z80 CPU does data reads whenever an instruction fetches an operand so you should not use data read breakpoints in code areas or the code will not run. On emulation targets this is not a problem.
When running with an emulation target, data read/write breakpoints always give a specific message when the breakpoint triggers, stating which address was read/written but the hardware ICE cannot tell which data breakpoint has triggered, so if there are multiple data breakpoints, the dialog will only give as much information as it can.
In addition to user breakpoints, the debugger also sets temporary breakpoints in order to run and step through code. The stepping process is explained here.
Breakpoints can be individually removed the same way they are added. To remove all breakpoints, use Debug->Clear All Breakpoints from the menu. All the breakpoints are removed every time a file is loaded as the addresses may have changed since the last load and the previous breakpoints may now be part way through Z80 instructions.