A Debug Target is what we call the device being controlled by the debugger. This can be a real hardware Z80 system or an emulation.
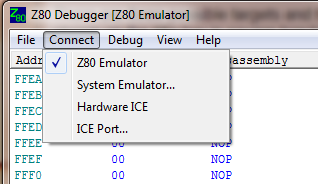
There are three possible targets and they are selected from the Connect menu. The currently selected target has a check mark (tick) next to the target on the menu and is shown on the title bar in square brackets.
In most respects, the debugger behaves the same for all targets but there are some differences explained below.
The first time you run the debugger, a dialog box will appear telling you to choose a target. Thereafter, each time the debugger is started, it will attempt to re-connect to the last selected target.
The Z80 Emulator is a built-in emulation of a Z80 system that has 64K of zero wait-state RAM and no peripheral devices. It is the simplest target to get started with but is quite limited in scope. It doesn't support interrupts and there is no way to get data in to or out of programs (IN/OUT instructions do nothing). It is useful for learning how to use the debugger, learning the Z80 instructions or benchmarking and tuning small code segments using the Performance Metrics.
To use the Z80 Emulator, simply choose it from the Connect menu.
The System Emulator target is a separate program which the debugger accesses over a TCP socket. The user is responsible for building a system emulation that contains all the features required to support the program(s) being debugged.
Performance metrics are shown the same as on the built-in emulation but the results can differ because it is possible to emulate memory with wait states and interrupts will often affect the result (just as on a hardware system). For example stepping a NOP when the interrupts are enabled and an interrupt is pending will count the entire interrupt service routine giving an execution time for the NOP of hundreds of cycles instead of just four.
To connect to the System Emulator, first choose it from the Connect menu. A dialog box will appear...
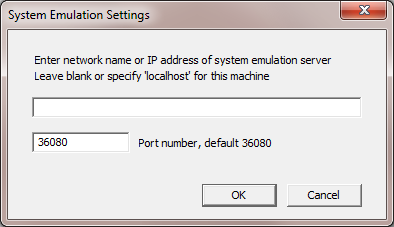
Enter the network name or IP address of the machine that is running the System Emulator. If it is on the same machine as the debugger, leave this blank or enter 'localhost'. There is the option to choose a different TCP port number if the System Emulator server is listening on a non-standard port. These settings are saved by the debugger and automatically re-connected the next time the debugger is started.
You can download the System Emulator example code from the Resources page. There is a readme.txt file that explains how it works and how to write emulations of your own peripherals.
To debug code on real hardware, you will need a Z80 in-circuit-emulator (ICE).
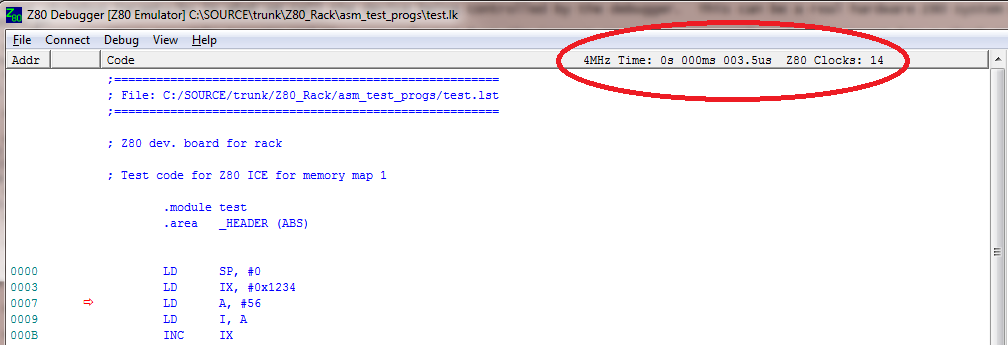
After each step or run, the total number of Z80 clocks and the elapsed time since the last stop is shown at the top of the Code View.
In this example, we have just stepped over the LD IX, #0x1234 instruction which takes 14 CPU clocks when running from zero wait-state memory and takes 3.5us on a 4MHz Z80. If we step over a CALL instruction, the value will be the total number of cycles taken by the called function.
On an emulator target, the emulated Z80 runs faster than a hardware Z80, but the clocks are counted and the execution time is calculated for a 4MHz CPU. On the Z80 Emulator target, there are always zero wait states (except for those that are internally generated by the Z80 for I/O instructions) and interrupts are not possible so the values always agree with the Z80 datasheet values. However, on a System Emulator or Hardware Z80, any wait states or interrupts that get serviced during a step will be counted in the performance metrics. If another bus master takes over the bus e.g. for a DMA transfer, the clocks will still be counted. The Hardware ICE simply counts clocks until the CPU stops and the System Emulation has software hooks that enable the extra wait states to be added by emulated peripherals.
The Model Z83 ICE contains a 24-bit hardware counter which counts Z80 clock cycles. This overflows after 16 million clocks (1 second at 16MHz) so the run time is also measured to a 1ms resolution. If the counter has not overflowed (normal for stepping code) then the clock count is displayed and the time is calculated from the measured clock frequency. If the counter has overflowed (normal if you stop running code) then the time is shown and the clock count is calculated. In this case the clock count is not exact and the headings are changed to 'Est' to show an estimate has been made.
The time shown for a hardware target is real elapsed time. If you step a CALL to a 100ms delay function, it will take 100ms to execute the step and the time shown will be 100ms. If you change the hardware clock frequency you will get a different answer for the time (same number of clocks). On an emulation target, the same number of clocks will be emulated in less real time (because the PC is faster) and the time shown will be for a 4MHz Z80 which you can scale to match your Z80 system frequency. Because the PC is so much faster than a real Z80, pressing RUN and waiting a few seconds, then STOP can result in enormous times being shown because a huge number of clock cycles have been emulated and the run time on a 4MHz Z80 is shown for that number of clocks.