To debug code on real hardware, you will need a Z80 in-circuit-emulator (ICE). It replaces the Z80 in your system and contains a CMOS Z80 which is clocked by your system clock. The ICE contains all the 'missing' debug logic that was never designed into the Z80 (unlike modern processors which contain debug logic). It connects to your PC over USB and looks like a serial (COM) port to the PC.

To configure the port, choose the ICE Port option on the Connect menu. The dialog lists all the available COM ports and the Auto Detect option tries all the available ports to find the ICE hardware. Once an ICE has been connected, the COM port is remembered and you just need to select the Hardware ICE option on the Connect menu to re-connect. If you connect a new ICE, the debugger will fail to connect on the previous port and you will need to configure the port again.
With a hardware ICE, the Z80 runs at the full system clock speed. The ICE doesn't stop the clock, refresh signals are continuously generated to maintain the DRAM contents (if the system contains DRAM) and circuits such as a video display are also kept alive. When a Z80 instruction accesses the system, it does so at full speed and any system-generated wait states control the cycle time. This is true of both normal running Z80 code and debugger generated memory or register accesses.
Many simpler ICEs for legacy devices step code by controlling the Z80 clock. This means that a step will enter an interrupt if one is pending. This debugger simply executes the whole ISR and returns, then stops at the breakpoint on the next instruction. For this reason, we have added control of the interrupts to give you a choice whether to service interrupts while stepping code.
The IE check box tells you whether the Z80 interrupts are enabled and the Block checkbox can be set to block interrupts when connected to hardware with the ICE. The difference between them is that the Z80 code can control IE whereas Block is a hardware feature of the ICE. If your system has a timer or similar interrupt source which is running from the Z80 clock or its own clock source, then every time you step the code, the interrupt will be serviced during the step. Block prevents this from happening.
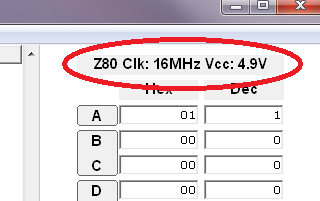
When using a Hardware ICE, the Z80 power supply voltage and clock frequency are displayed above the registers.
Three ICE models are available with different performance and features. If the measured values are out of specification for the ICE, a error dialog will be shown.
| Model | Min. Freq. | Max. Freq. | Breakpoints | Perf. Metrics |
|---|---|---|---|---|
| Z81 | 1MHz | 4MHz | Program | |
| Z82 | 1MHz | 8MHz | Prog. & Data | |
| Z83 | 1MHz | 16MHz | Prog. & Data | Yes |
All models have a minimum Z80 clock frequency of 1MHz. The Z80 in the ICE doesn't have a minimum clock speed but the ICE's debug logic needs this to be at least 1MHz. You cannot use the ICE with a system that stops the clock or runs it slower than 1MHz.
When you run your Z80 code from the debugger, the Z80 in the ICE is connected to the system as if there were no ICE and runs at the full system clock speed. All signals operate the same way except that breakpoints will stop the code and a system reset will be detected by the ICE and stop the debugger.
When the debugger is showing the Z80 stopped at an address, the Z80 in the ICE isn't actually stopped. It is running and generating refresh cycles for DRAM but the outgoing nRD and nWR signals are gated off so the system is not affected and the incoming interrupt signals are also gated off so the ICE's Z80 doesn't try and execute an interrupt routine.
All models support unlimited program breakpoints (64K of them). Model Z81 doesn't support data breakpoints (read/write memory access at a specific address). Models Z82 and Z83 support unlimited data breakpoints.
The 16MHz model uses a 20MHz Z80 but the timing is such that it cannot run at 20MHz. With a 20MHz clock, the Z80 nM1 signal doesn't go low until after the clock edge used to capture the breakpoints so the ICE logic can't stop the instructions being executed on a program breakpoint.
Only the 16MHz model supports performance metrics. This is done with a hardware counter which counts the Z80 clocks and a timer which makes an estimate if the counter overflows (max. 16 million clocks). The displayed information shows whether the metrics are exact or estimated.
You should read the general restrictions and behaviour of stepping code which apply to both emulation and hardware ICE targets.
You should also be aware of some breakpoint restrictions.
In addition, there are some extra restrictions when debugging with an ICE. 99% of the time these situations don't occur but we list them here so you know what to avoid / expect.
On an emulation, if you run some code and the Z80 reaches a HALT instruction then you press STOP in the debugger, it shows the PC pointing to the HALT instruction. That doesn't happen with a hardware ICE.
On an ICE, if the CPU is stopped at a HALT instruction, pressing STOP shows incorrect register contents until a reset. If you press the debugger RESET button, the PC will be set to zero and the other registers will show the correct contents again. If you do a system (hardware) reset the code will run and the registers will likely make no sense. In both cases, the address of the HALT instruction is lost.
The reason for this is that the Z80 HALT instruction is unique in that it is the only instruction that stops fetching opcodes from memory. It simply executes internal NOPs until a reset or interrupt occurs. This means the ICE cannot break out of a HALT state. Stepping a HALT instruction will work correctly if there is an interrupt but without an interrupt, it will stop on the HALT and need a reset.
Workaround: If your code is on a HALT instruction, the only option is to press STOP followed by the RESET button and the PC will be set to zero.
Workaround: We recommend you avoid using HALT in your code if possible - try an infinite loop (jump to self) instead.
The Z80 doesn't enable interrupts until it executes the instruction after the EI. In other words, one instruction after you would expect - EI has a delayed effect. The reason is so that interrupt service routines can have an EI / RETI pair at the end and the ISR will exit before re-entering the interrupt. If interrupts were enabled immediately after the EI instruction, another pending interrupt would cause the Z80 to re-enter the ISR without 'cleaning up' the first interrupt. Although the return addresses are stacked, the RETI instruction restores the IE flag with just one copy and the Z80 peripherals unchain their interrupts by detecting the RETI instruction on the bus so nesting interrupts is a problem. The Z80 deals with this problem by delaying the effect of EI, giving time for the foreground context to be established before taking another interrupt.
However, when using the debugger, if you step the EI and stop on RETI, the Z80 in the ICE will continue to execute instructions and the interrupts will be enabled. If there is an interrupt pending, the next step will re-enter the ISR and lose the context that RETI uses to return to the forground code.
It is also possible though extremely rare that a step will stop on the interrupt vector due to an interrupt becoming active during the instruction. Normally interrupts become active before the step and the interrupt is serviced before the stepped instruction, then the instruction is executed and the breakpoint is hit. In this unusual case, the interrupt only occurs after the stepped instruction has started. At the end of the instruction, the interrupt is recognised at the same time as the breakpoint so the Z80 goes to the interrupt vector and the PC is set to there instead of the stepped address. This has been observed when stepping immediately after the EI.
Workaround: When stepping after an EI, block the interrupts from the debugger.