The Z80 debugger is free and it can be downloaded from the Resources page.
It is a single Windows executable file that should run on any modern version of Windows. It runs on both 32-bit and 64-bit versions of Windows. Other operating systems are not supported.
In addition, there is an optional .zip file containing source code for building a custom System Emulator.
To install the debugger, just copy the executable to a folder and make a shortcut on your desktop. When run for the first time, the debugger will write some settings files to the same folder so you shouldn't put the executable in your desktop folder or the settings files will also appear on your desktop.
You may need Administrator priviledges to install or run the debugger. You may get Windows firewall or anti-virus pop-ups when you run the debugger which you will need to deal with. The debugger generates network traffic to check for updates and to connect to System Emulations and invokes your web browser to display help pages. You may need to add the debugger to a 'safe application list'.
The debugger allows you to emulate a Z80 CPU with or without a wider system and also allows you to connect to a hardware Z80 using a Z80 in-circuit emulator (ICE).
The first time you run the debugger, the Z80 Emulation target will be selected. The Connect menu allows you to switch between targets. On subsequent runs, the debugger will re-connect to the last target and it remembers the settings for each target connection.
The debugger screen is split into four main areas shown below...
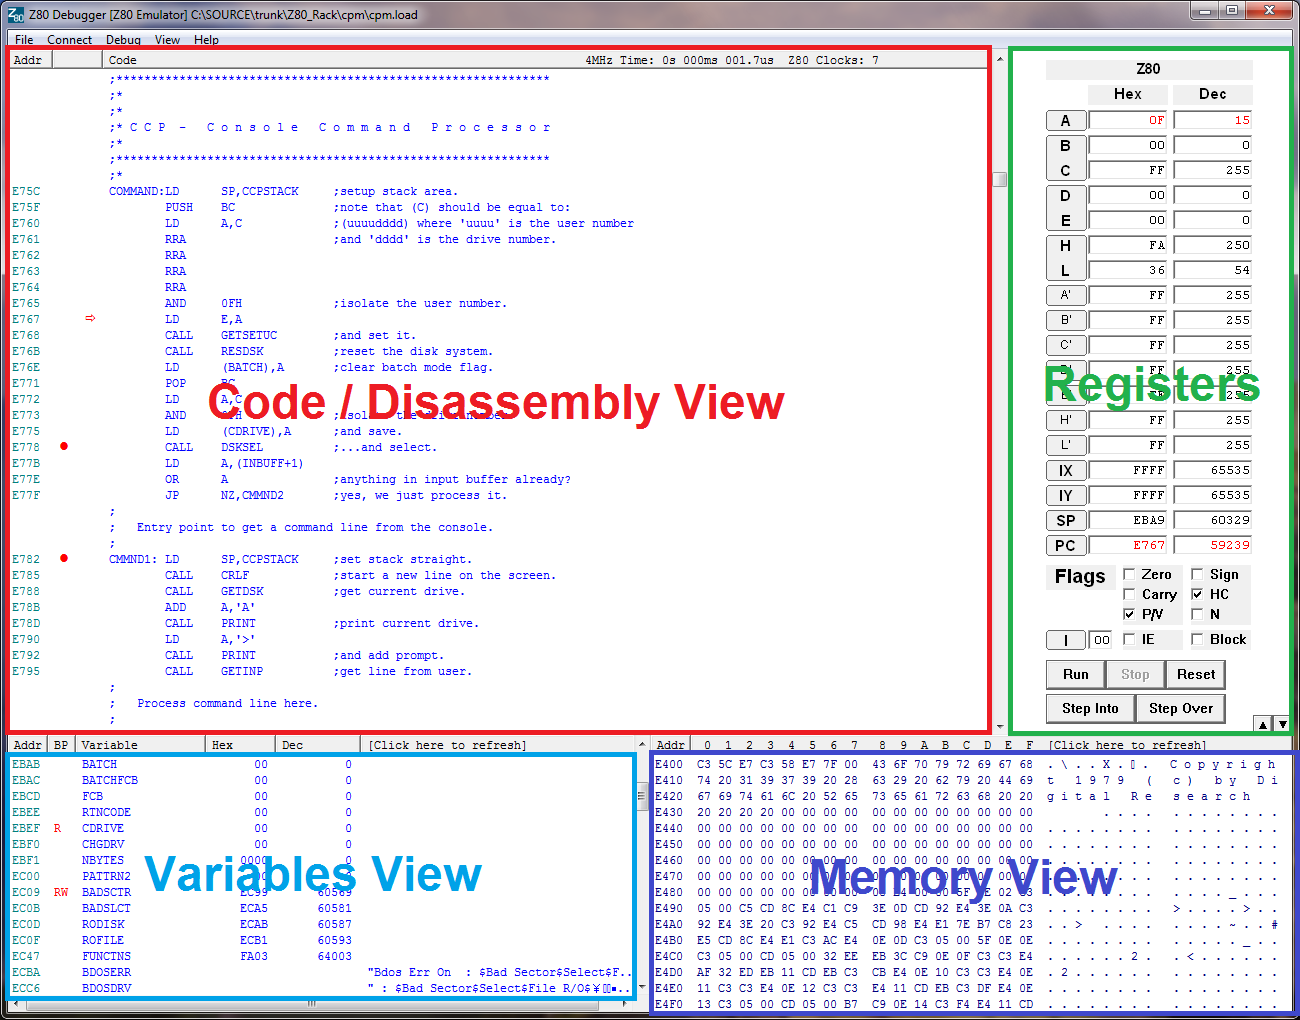
The largest area is the Code View. This shows your source code after it has been loaded. When there is no source code, a Disassembly View is shown instead. If both views are available, pressing F12 switches between them.
The Disassembly View reads the Z80 system memory and disassembles it. The opcodes are shown as well as the mnemonics.
In contrast, the Code View shows your source code files and the contents of the Z80 memory may not be the same as the files. For example, if you try to load code to an area of ROM or swap memory banks, the source code may not behave the way you expect. The debugger does some basic checks when you first load code but the only true measure is to switch to the Disassembly View.
More information on the different views.
The execution point (current PC address) is shown as a red arrow and breakpoints are shown as red dots. Double-clicking a line toggles the breakpoints on and off. There is no limit to the number of breakpoints.
More information on breakpoints.
When stepping code, the Code View automatically adjusts so the execution point stays in view. You can move the Code View with the scroll bar or keyboard keys but the view will snap back to the execution point when a step is done.
All four areas are greyed out when the Z80 is running.
More information on running and stepping code.
Ctrl-F (Find) and F3 (Find Next) can be used to search the Code View for functions that you want to view or put breakpoints on. Find doesn't work in the Disassembly View.
Ctrl-G allows you to Go To a particular memory address.
At the top right of the Code View are the Performance Metrics.
The Register View shows the current register contents in hex and decimal and the CPU flags. When the Z80 is stopped, the values can be freely edited and the new values will be used when the code is run or stepped. Register values that have changed since the last stop are shown in red.
If you change the PC, the Code View will show the code at the new PC address. You can run or step from an adjusted PC but the consequences need to be considered e.g. registers may need values restoring or the stack pointer may have to be adjusted to ensure functions return etc.
The main registers are shown in a bold font and the alternate register set (A'-L') are shown in a lighter font. The I register is shown below the flags. The alternate flags (F') and Refresh (R) register are not shown. The CPU flags can be observed and changed in the same way as the registers. The IE flag is the interrupt enable which is set by the EI instruction. The Block check box can be used to block interrupts independently of the state of IE, see Interrupt Controls for further information.
Below the flags are buttons that can be used to run and step code though, once you get used to using the debugger, you will use the hot keys instead.
The Variables View shows the values of variables that the debugger has discovered in source files. There is no support for local variables in C functions which change with the stack frame so SDCC projects only show global variables. Also note that two source files with global variables of the same name will appear twice in the list. If they are of the same type, the only way to tell them apart is by the address.
Simple variables up to 4 bytes are refreshed on every code step but variables that seem to be buffers or strings are refreshed when [Click here to refresh] is clicked on the heading bar. At present there is no support for editing the variable values.
Note that you should avoid defining a variable name for a read-sensitive peripheral register. For example, if in your source file you say...
RXD: DB 0 ; RX DATA on UART
...the debugger will add RXD to the variable list and read it after every step so you will lose the UART characters. This can be avoided by using EQU or (base + offset) constructs. Any data declaration like DB, DW, DS etc. with a label will be picked up by the debugger and added to the variable list.
The Memory View shows a 256 byte memory dump in hex and ASCII. This picture shows the controls...
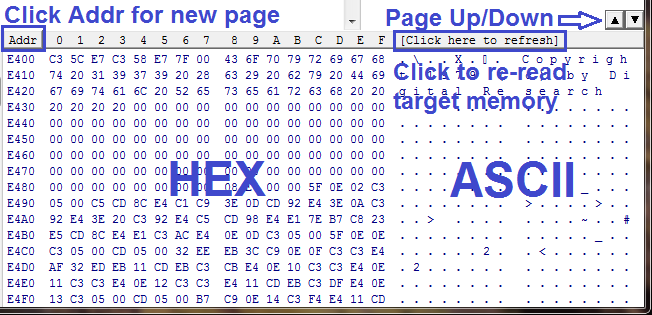
The Page Up/Down arrows can be used to walk the memory. Each button press reads a new page from the target memory. Be careful to avoid read-sensitive peripheral registers.
To change the start address, click on the 'Addr' heading or select Show Memory from the View menu. The following dialog appears...
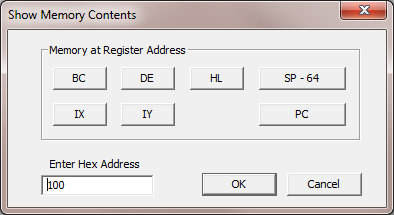
Pressing any of the register buttons shows memory at the address in the register. All the registers that can be used as pointers are shown along with the current PC. To view the stack, press the 'SP - 64' button. This shows 4 lines of data (64 bytes) before the SP and 12 lines after the SP so both pushed and popped values can be seen.
To select an arbitrary value, simply type the hex address into the box and click OK.
In all cases, the hex dump start address will always end in zero and the requested address will be somewhere on the first line.
The Memory View is not updated when stepping. Clicking on the heading marked [Click here to refresh] will re-read the memory contents. At present there is no support for editing the memory contents.
If you are connected to a hardware Z80 system, you can debug any code that is already present e.g. in ROM. If you are developing your own software, the debugger can load code into the target memory. This can be a binary file that is loaded to RAM or a complete project where the source code is loaded into the Code View and the matching binary file is loaded to target RAM.
To load a binary image, select Load Binary from the File menu, pick a file and a load address. Binary files can be included in .load files to load a number of blocks of code/data to different addresses without picking the file and load address each time.
To load source code, select Load Source from the File menu, pick a file type from the filter box and a file to load. See Loading Files for a list of supported file types and how to use them.
The last 8 loaded files are shown on the File menu for easy access.
The Z80 code can be stepped through using the buttons in the register view or by using Function keys. Run To is only available with a right click...
| Operation | Key | Button | Menu | Effect |
|---|---|---|---|---|
| Reset | Yes | Reset Z80 | ||
| Run | F5 | Yes | Yes | Run from current PC |
| Stop | F6 | Yes | Yes | Stop Z80 |
| Step Over | F10 | Yes | Yes | Step Over |
| Step Into | F11 | Yes | Yes | Step Into |
| Run To | Mouse Right Click | Run to clicked line |
Register values go red if they have changed after each step. The PC can be set to any address and execution resumed from there. Right clicking a line will run up to that line. When the CPU is running, the code view is greyed out - if you right click and the code view goes grey, it means the Z80 hasn't reached the line you clicked on and you'll have to press Stop.
More information on stepping code.